No products in the cart.
Swap Hunter MT4 Indicator Package Unlimited
$15
Swap Hunter MT4 is a pro indicator suite for carry trading. Analyze correlation, swaps, trends & volume to earn from overnight interest with reduced risk.
Instant Digital Delivery
Receive your product instantly via email right after purchase.
Unlimited Version
All products sold on our website are full, unlimited-use versions.
Free Updates
Any new versions we receive will be automatically added to your account.
All-Inclusive Pricing
No hidden fees—what you see is what you pay.
Categories: FTMO, Prop Firms, Gold, Includes DLL, INDICATOR, Indicators, Low Drawdown, MetaTrader 4, Prop Firm, TRADING SYSTEM
Swap Hunter MT4 Indicator Package.zip
Swap Hunter MT4 Indicator Package
7 Indicators / DLL
Unlimited + Free update
Product link:
https://www.swap-hunter.com/product/
Reviews:
https://www.youtube.com/@swaphunter4476
Swap Hunter – Correlation Matrix Pro
Contents
The Correlation Matrix Pro shows you multiple correlated Asset Pairs that you can hedge in order to mitigate your Risk and generate Swaps at every Rollover
Shows two Groups of Asset Pairs ordered by Strength of Correlation over a Period of 60-100 Days. Asset Pairs to the Left have a positive Correlation, the Asset Pairs to the Right have a negative Correlation.
The Correlation Column shows the strength of the Correlation, accompanied with a color coding System. Making it clear to understand which Asset Pairs have the strongest Correlation.
The Swap Long and Swap Short Columns help you to understand which Asset Pair to Buy and which one to Sell and also shows the Swap Value of the Asset.

Swap Hunter Correlation Matrix Pro gives an overview of all Asset Pairs
Displays the Net-Swap of the Asset Pair if you trade that Pair. Simply hover with your Mouse over the Net-Swap Box to get Net-Swap calculated.

The net Swap for the correlated Pairs

Swap Hunter – Correlation

Swap Hunter Correlation: Graphical representation of the strength of the correlation
(Strong positive Correlation with 94.3%)
(Strong positive Correlation with 94.3%)
The Correlation gives you a graphical Representation on a Chart of the Strength of the Correlation between an Asset Pair over a Period of either 60 or 100 Days
The Closer the Red line is to 1, the stronger the correlation is between the Pairs. The +1 represents a positive Correlation, while the -1 represents a negative Correlation.

Correlation in Detail, 94,39% is a very strong Correlation


Swap Hunter Pro Level
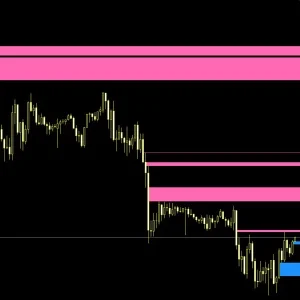
The Pro Level gives you Indications where to Enter and Exit your Trades based on Support and Resistance Levels
The Levels are Customizable through the Indicators Properties Tab, in order to fit your Trading Strategy and Style.
The Levels can be set by using Percentages, which can match the average Range of the Asset Pairs.

Show the Entry and Exit Points for your Trades
Swap Hunter – Moving Averages

Moving Averages Trend Analysis
Assortment of exponential moving averages for professional trend analysis. These EMAs have Periods of 200, 100, 50 and 20 for fast identification of trends and entry-level direction.
The Default Settings of the EMAs match the Industry Standards but are customizable to fit your Trading Strategy and Style.
Swap Hunter – Volume Profile
Areas of increased volume (High Peaks) characterize Levels of Support and Resistance which could indicate an End to a Trend. On the other Hand, Low-Volume (Low Peaks) indicate Areas that have corrected or reversed strongly.
The volume is displayed as a horizontal histogram. You can define the number of candles on the the chart in the Indicators Properties.

See traded volume at a certain price level

Current spread and remaining time
Swap Hunter S2T2
The S2T2 shows the Asset Pair, the Spread, and the Time remaining until the next candlestick appears
Always instant download after payment
You can download future updates if available. at the same link above. Or message me with payment screenshot and receive EA via telegram.
✉️ Support 24/7 : https://t.me/TopEAstore_Support
Related products
Fix / No DLL
$10
$15
Fix / No DLL
$10
Fix / No DLL
$9
EXPERT ADVISOR
$20
Fix / No DLL
$15
-100%
EXPERT ADVISOR
$20


